

If you’re not familiar with the recent Destiny saga, you’ve missed a wild ride.
Back in February, we were one of the first to cover this company; exploring their idea to launch the world’s first ETF for pre-IPO secondaries.
Boy, has a lot happened since then:
Along the way, Destiny picked up a ton of press — and indeed launched a revolution in bringing pre-IPO shares to the masses.
But there’s a lot more going on behind the scenes that investors should understand.
Today, we’re conducting an in-depth analysis of DXYZ’s post-launch journey. We explore how the fund’s mechanics allowed the price to soar so high, and uncover clues about the future hidden deep in DXYZ’s public filings.

This detail-heavy issue is not sponsored or endorsed by Destiny. (DXYZ is a previous sponsor of Alts, but our requests for comments on this article were not answered).
If you’re serious about investing in private alternative markets through public structures, these are details you can’t afford to ignore.
By the end, you’ll understand why DXYZs shares got so high, why they sank, and a whole lot more.
Let’s go 👇
Note: This is a paid issue. The first half is complimentary. But there is way too much good stuff in this second half for it to be free. Get the All-Access Pass to read the whole thing.
Table of Contents
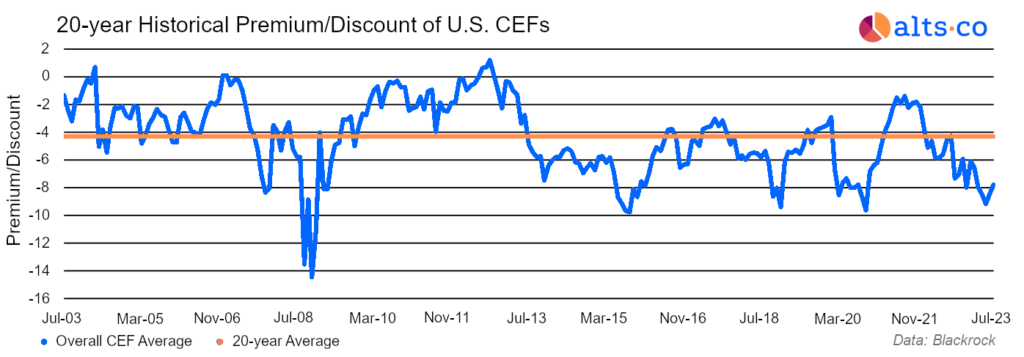
The problem with premiums
To really understand DXYZ, you need to discuss a basic financial truth that’s often conveniently ignored:
Without an arbitrage mechanism, there’s no reason a claim on an asset needs to trade in line with the value of the underlying asset.
That might sound technical, but here’s what I mean…
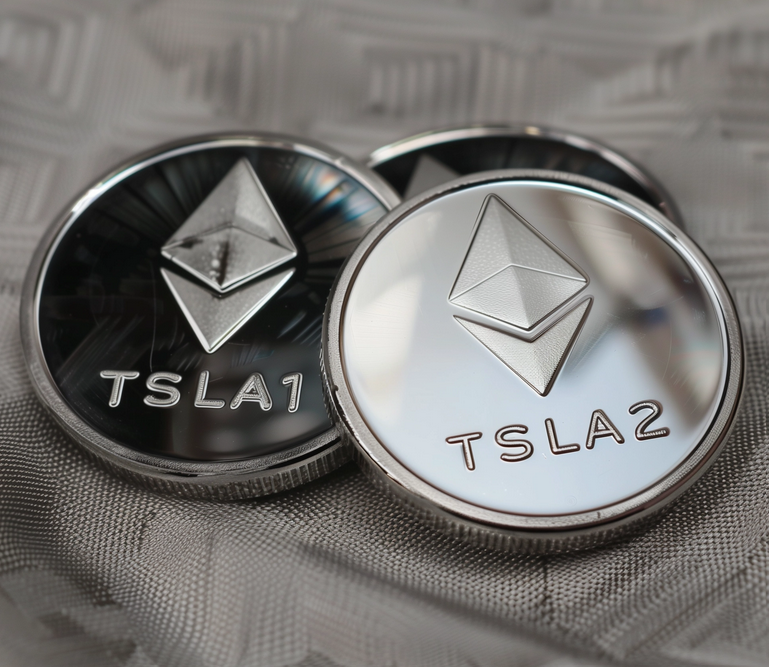
Suppose I create two near-identical digital tokens, one called TSLA1 and the other called TSLA2.
I conduct an ICO for both tokens, announcing that the proceeds will be used to purchase Tesla stock, with each token representing a 1-for-1 claim on the underlying shares.
Reading carefully, though, you notice a big difference between the coins:
- TSLA1 is freely convertible into actual TSLA shares at any time (and vice-versa).
- TSLA2, meanwhile, isn’t actually convertible into TSLA shares at all.
Given the above, what should we expect the price of each token to be?
TSLA1 is clearly going to trade at a price very close to TSLA stock.
If the price between the token and the stock ever diverges, you could buy the cheaper one, and convert it to the more expensive one to earn a profit.
But what about TSLA2?
Since converting the stock is impossible, there’s no reason the price needs to track the underlying stock.
This illustrates a crucial point about valuing fund shares:
The trading price for a fund’s shares depends not only on what the fund invests in — but on the conversion process that links those shares with the underlying investments.
Why open-end funds work so well
Which brings us to open-end funds (OEFs).
You’ve almost certainly invested in an OEF before. Exchange-traded funds (ETFs) fall under this category.
OEFs are unique because they’re allowed to create and destroy shares on a continuous basis.
As a result, OEF shares trade at a near-identical price to the fund’s underlying net asset value (NAV, or the actual value of the assets in the fund).
With an ETF, “authorized participants” (typically investment banks) can create or destroy shares. This lets them profit from any difference between the share price and the NAV.
They do this by:
- Delivering a basket of the underlying assets to the fund in exchange for fresh shares (creation), or
- Redeeming existing shares for a proportional share of the underlying assets (destruction).
To illustrate how powerful this continuous share adjustment is, the gap between the daily closing price and the NAV of the AGG ETF (one of the most popular bond funds in the world) has averaged just 0.08% over the past five years.
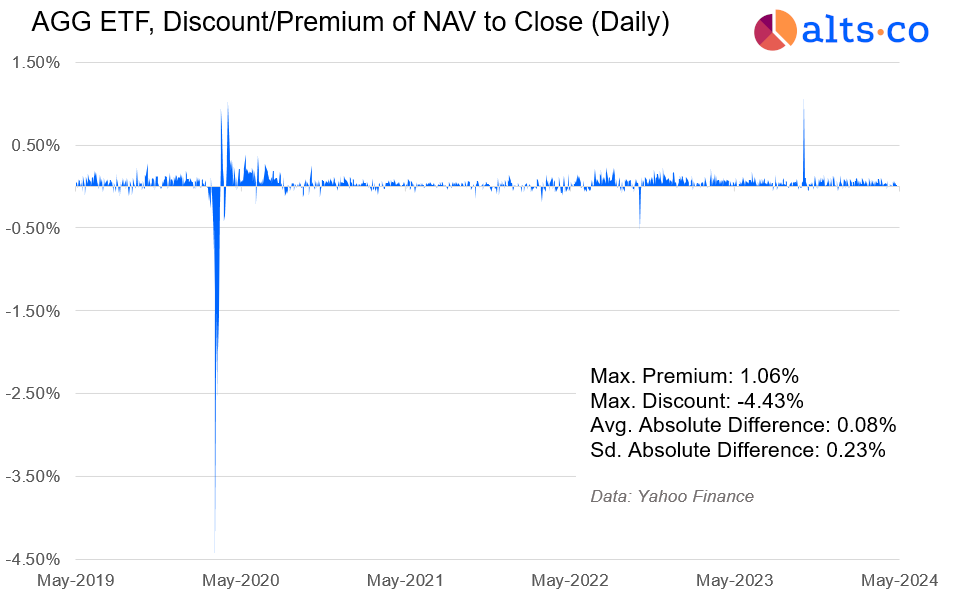
Here’s the bottom line: because they’re open-ended funds, ETFs can dynamically adjust their number of shares to link share prices to the actual NAV.
But know who can’t do this? Closed-end funds.
They simply don’t have that luxury.
Arbitrage is hard for closed-end funds
Unlike OEFs, closed-end funds (CEFs) cannot continuously create or destroy shares. (Only rare corporate actions can adjust share count.)
As a result, these funds can’t use the same dynamic system as ETFs to keep share prices in line with NAV through arbitrage.
That leads some CEFs to decide to stay off exchanges. It’s not worth the hassle.
But there are plenty of exchange-listed CEFs. And as you’d expect, their trading prices don’t always align with the underlying fund value.
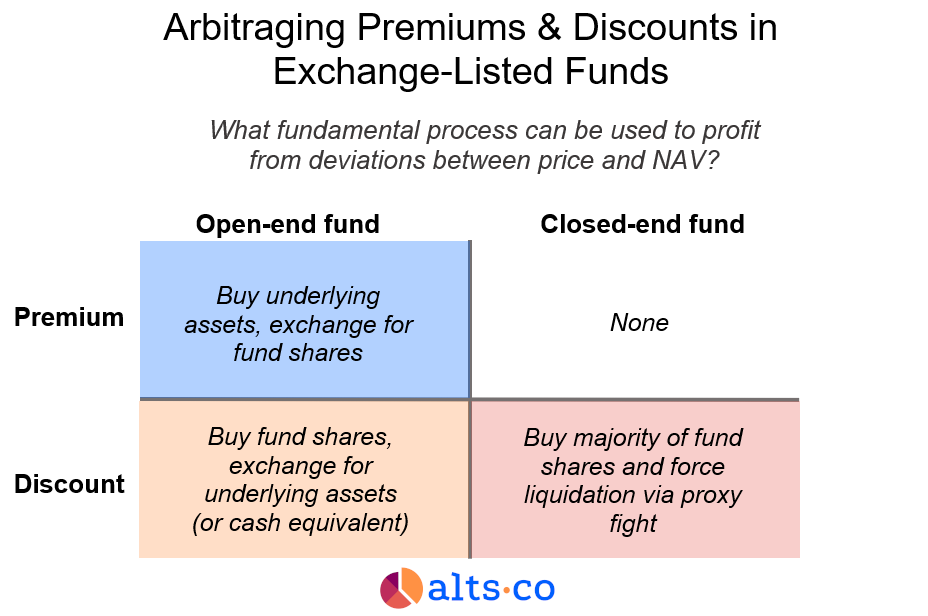
If OEF shares are trading at a discount, there’s an easy arbitrage opportunity: Just snap up as many shares as you can, and redeem them with the fund for your share of the NAV.
But to do a similar arbitrage with a CEF, you’d need to:
- Buy a majority of outstanding fund shares, then
- Replace the fund’s board of directors via proxy fight (fun!)
- Force the fund to liquidate at NAV, paying out the proceeds to shareholders.
Although out of reach for individual investors, this is actually a well-known strategy employed by hedge funds — and is a big reason why CEF discounts can’t grow forever (the bigger the discount, the more attractive the arb!)
But here’s the thing: this arbitrage doesn’t solve for premiums.
Unlike a CEF discount, a CEF premium (where shares are overpriced relative to NAV) has no investor-led arbitrage process that can force prices to converge to their true value.
Buying up shares and liquidating at NAV would yield negative returns – and shorting fund shares, while creating selling pressure that could drive the price down, won’t force convergence on its own.
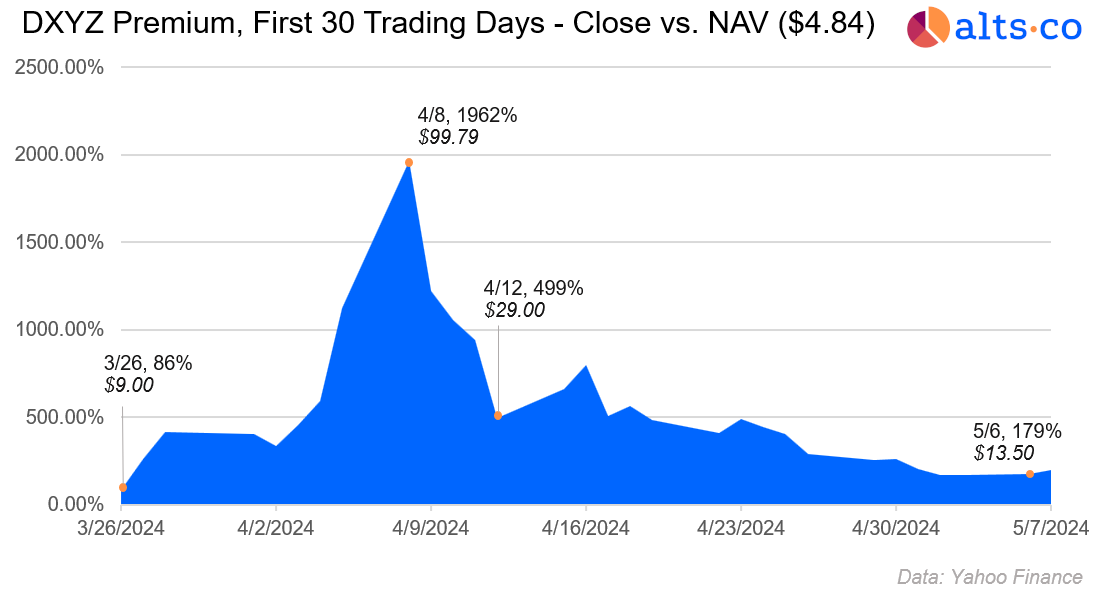
This is why share price of DXYZ was able to go so high.
At one point it exceeded a 2,000% premium over the underlying NAV!
- Because DXYZ is a closed-end fund, and
- Because shares traded at a premium, not a discount
- There was no investor-led conversion or arbitrage mechanism to ensure price ever tracked NAV.
The price was allowed to go higher and higher, completely disconnected from the underlying assets.
Why did DXYZ have such a high premium?
According to DXYZ’s own latest calculation, their net asset value per share was just $4.84.
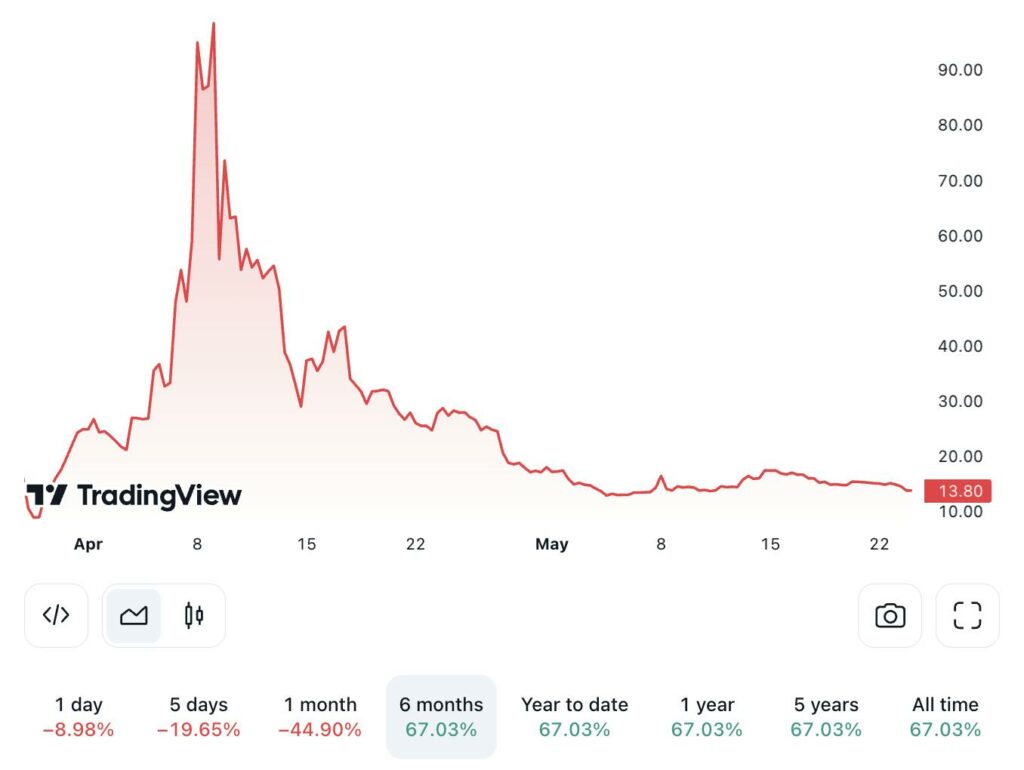
But at its peak, DXYZ’s shares traded at more than $100.
In other words, if you bought at $100, you got about 5 dollars in exposure to the underlying portfolio of private companies. The remaining $95 you spent was entirely to DXYZ’s premium.

At the time of writing, DXYZ’s share price has fallen to around $14, which still leaves a premium of around 200%.
Since each share of DXYZ includes exposure to the fund’s premium, understanding that premium (and the extent to which it will grow/shrink) is paramount for investors.
We’ve established that a lack of arbitrage opportunities makes it possible for a high premium to occur.
But what’s actually driving the gap between price and NAV?
Was this all just another case of excitement and hype?
Or is there something else going on?
Is DXYZ’s NAV price fundamentally wrong?
The most generous explanation here is that the NAV is fundamentally wrong; that that the market has reason to assign a higher value to DXYZ’s shares.
Was it calculated incorrectly?
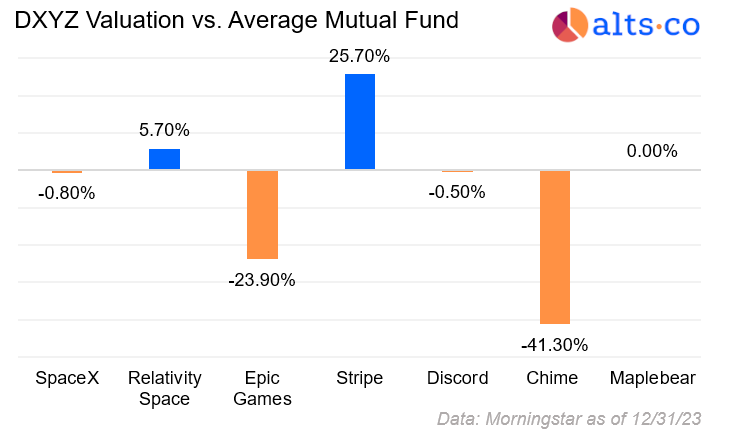
To me, it seems unlikely that DXYZ’s NAV has been calculated incorrectly.
This is a team of very smart people, and their valuations are roughly in line with mutual funds that hold the same companies (especially for SpaceX, which makes up more than 30% of the entire portfolio.)
Was the NAV just outdated?
Remember, DXYZ’s last reported NAV was at the end of last year. Has the underlying portfolio seen huge growth in the past few months?
I don’t think so. If it was, we’d see evidence of that growth in places like Forge’s Private Market Index.
Perhaps the NAV is simply wrong for a liquid retail product? Non-accredited investors have fewer options for investing in private shares, so they probably place a higher value on the few avenues they do have.
Furthermore, retail investors may simply be more optimistic than VCs about the growth potential for the underlying companies.
We recently spoke with Will Snape of OpenVC, a firm building indexing solutions for private markets.
Will largely agreed with the this retail demand-driven hypothesis, saying:
“There’s no silver bullet answer to the frenzy around DXYZ for the past ~7 weeks, but we believe a large component of the price is reflective of the massive retail demand that has been pent up for decades. We’ve seen similar structures overseas like LITs in the UK trade at significant premiums — but none as high as this. DXYZ’s runup is undeniable proof of profound pent-up demand, and, in our view, you’re going to see more strategies pop up to try and service that demand in the coming years.”
– Will Snape, OpenVC
Attributing DXYZ’s premium to a supply/demand imbalance sounds perfectly logical.
But this is not the full story.
There are other explanations which are, shall we say, less-generous.
There is way more to this story…
In the first half we’ll showed you why DXYZ got so high.
In the second half, we’ll show you why it sank.
The rest of this issue has some really valuable data and predictions we cannot just give away for free.
It’s so valuable, we can’t even bullet it out.
Gotta upgrade for this one!